I agree. Most of the measurements we get, such as LDL, are just indicators of the main problem, which is obesity.
Chances are that if your BMI is in the low normal range, your lipids will be normal, and your risk of heart disease will be greatly reduced.

1 Like

I asked this question to the president of the American Heart Association recently, and he said it is likely due to the explosion in rates of obesity and insulin resistance (and diabetes).

He also says the whole paradigm will change due to GLP-1RA and SGLT2i drugs. Fatality rates from MI are getting lower, but we will likely have more people living with CVD, and living for longer. 27% of diabetics have heart failure, and just look at the number of diabetics - 40 million Americans, something like 140 million Chinese. (Chinese rates of diabetes are worse than the US, and it seems to hit them more severely).

This all means that there’s a “new” disease on the block - heart failure with preserved ejection fraction (HFpEF, pronounced “heff-peff”) which is absolutely skyrocketing. That seems to be a disorder driven primarily by physical/mechanical issues (hypertension) combined with metabolic (insulin resistance).

The major issue, IMO, is that our “primordial prevention” at the society level is still completely lacking. Vast majority of doctors out there will say LDL-C of 100 is normal, and a chunk of the public think taking cholesterol-lowering drugs is poisonous (but donuts are fine), and they have an incredibly distorted view of what a healthy person should look like because almost everybody is overweight. It’s hard for me to comprehend what would have to happen for us to make a dent in the numbers.

4 Likes

I don’t think people suddenly started to get fat in 2010. I spent a couple of months in S Korea in the early 2000’s and was shocked coming back to the US then as everyone looked obese compared to what I was used to in Korea.

2 Likes

Yeah, sorry, none of the supplied explanations so far are convincing in the least. The lipid recommendation happened a couple of years later, whereas the rocket up of rates was strikingly evident 2010-2011. Plus deaths don’t rocket up within months of stopping statins. And obesity, insulin resistance were present in numbers for a long time by then, as mortality rates were still declining despite those rates, until a really bizarre u turn literally on a dime in 2010, seemingly within months. It’s as if a meteor struck. Almost seems like some kind of statistical artifact or data anomaly - maybe the methodology changed in some unacknowledged way. Just bizarre.

I used Manus (awesome AI agent) to generate a graph of CVD mortality Vs statin use - doesn’t agree at all with the chart above.
I’ve created a visualization showing the relationship between US cardiovascular disease (CVD) mortality rates and statin use over the past 30+ years. Here are the key findings:

  1. There is a clear inverse relationship between CVD mortality rates and statin use since 1987 (when the first statin was approved in the US).

  2. CVD mortality rates have declined significantly, from approximately 330 per 100,000 in 1987 to 161.5 per 100,000 in 2019 (a reduction of about 51%).

  3. During the same period, statin use increased dramatically from less than 1% of adults in 1987 to 35% by 2019.

  4. A notable acceleration in statin use occurred after 2013, when the American College of Cardiology and American Heart Association (ACC/AHA) released new guidelines that significantly expanded the criteria for statin therapy.

  5. Between 2013 and 2019, statin use increased by 149%, from 37 million users to 92 million users

2 Likes

Both have pretty severe side effects.

My hypothesis is that normies started to use the internet, searches for facebook peaked 2010, smartphones like iPhone were useful. It was too much power (unlimited information) in the hand of a normie, for better or worse. If there’s only a few factors that’s important for cardiovascular mortality, more information is probably not better.

Some interesting facts is that keto diet became popular in 2019, since then relative searches for “high cholesterol” doubled.

But I couldn’t find confirm that people thought e.g dietary guidelines were bad. People have searched for e.g “best butter” (red) much more than “best olive oil” (blue).

1 Like

The chart only shows an increase in 2015 (no datapoint before?): Cardiovascular Health - #1679 by AnUser

Here’s the trend for the topic “healthy user bias”, which is something you encounter when you start learning about low carb or keto and is used to dismiss observational studies as if that’s the only evidence, it started around 2015.

There’s a lot of videos, posts, etc, today, in favor of factors that increase cardiovascular disease and mortality.

1 Like

Not buying obesity rates as an explanation for the hockey stick. Male obesity rates did not drop from 1980 to 2010 and then spike up after 2010. If anything obesity has been steadily rising since 1980.

Yes, the data is in 5 year increments. That’s why it’s straight lines between the data points and not squiggly waves. But that makes it only worse. A straight line between 2010 and 2015 is the gentlest slope upwards, implying proportionate increases every year, so if we call that period 2010-2015 “100%”, then every year increased by an even 20%. You can’t get more gradual. If you posit instead that there was a slower growth from 2010 to 2013, then you must correspondingly explode the line even more sharply 2014-2015 to make it to the next data point in 2015. That makes the extreme accelleration problem much worse. So if you didn’t like saying “it looks like in mere months there was a u-turn in falling rates going to rising rates”, and so you stretch that over 2-3 years, then you have the exact same problem only significantly worse when you get to 2013-2015, because now you have to say: “gee, it looks like there was a dramatic spike in a matter of weeks”. The longer you slow the upturn the sharper you have to make it later to catch up to the data point. Furthermore, as the other poster indicated, statin use didn’t drop, instead it rose starting shortly before the revised guidelines of 2013 - looking at that chart he posted, the increase was massive. Now, I don’t think we have any grounds for saying the statins increased mortality, rather we would expect, at the very least for statins to decrease mortality in secondary prevention, because of relatively short period of time of two years (2013-2015), we would not expect much primary prevention over two years - it should have at least started moderating fatal MACE events in those who already had a previous event - secondary prevention should limit deaths.

Anyhow, I don’t think we have had a good explanation so far - any way you look at that graph, there must have been an extremely sharp spike at some point - in fact, that straight line makes it the least sharp spike possible geometrically.

Still looking for an explanation. Almost looks like those re-evaluations of the French Paradox, where it was hypothesised that the way deaths were recorded in France, they undercounted CVD as a cause of death, thus seemingly showing better CV health and French Paradox - if instead you normalized the data, by re-classifying various deaths that were reported in separate terms all under the one umbrella term of CVD deaths the paradox disappears. It looks like some kind of data issue. If not, then it really is a super odd situation, when it looks like a infectious disease epidemic curve of mortality - from going down to suddenly and very sharply reversing direction, where you can point and say “here is where the virus struck”.

1 Like

They can, but as with many drugs, it is advised to start low and go slow. The newest of the two, febuxostat has fewer side-effects, but insurance may not cover it. This recently happened to me, so I’ve been on allopurinol for about a week. It makes me feel queasy while sitting down, faint and dizzy when I run. I just ordered febuxostat from India for about 10 cents a tablet.

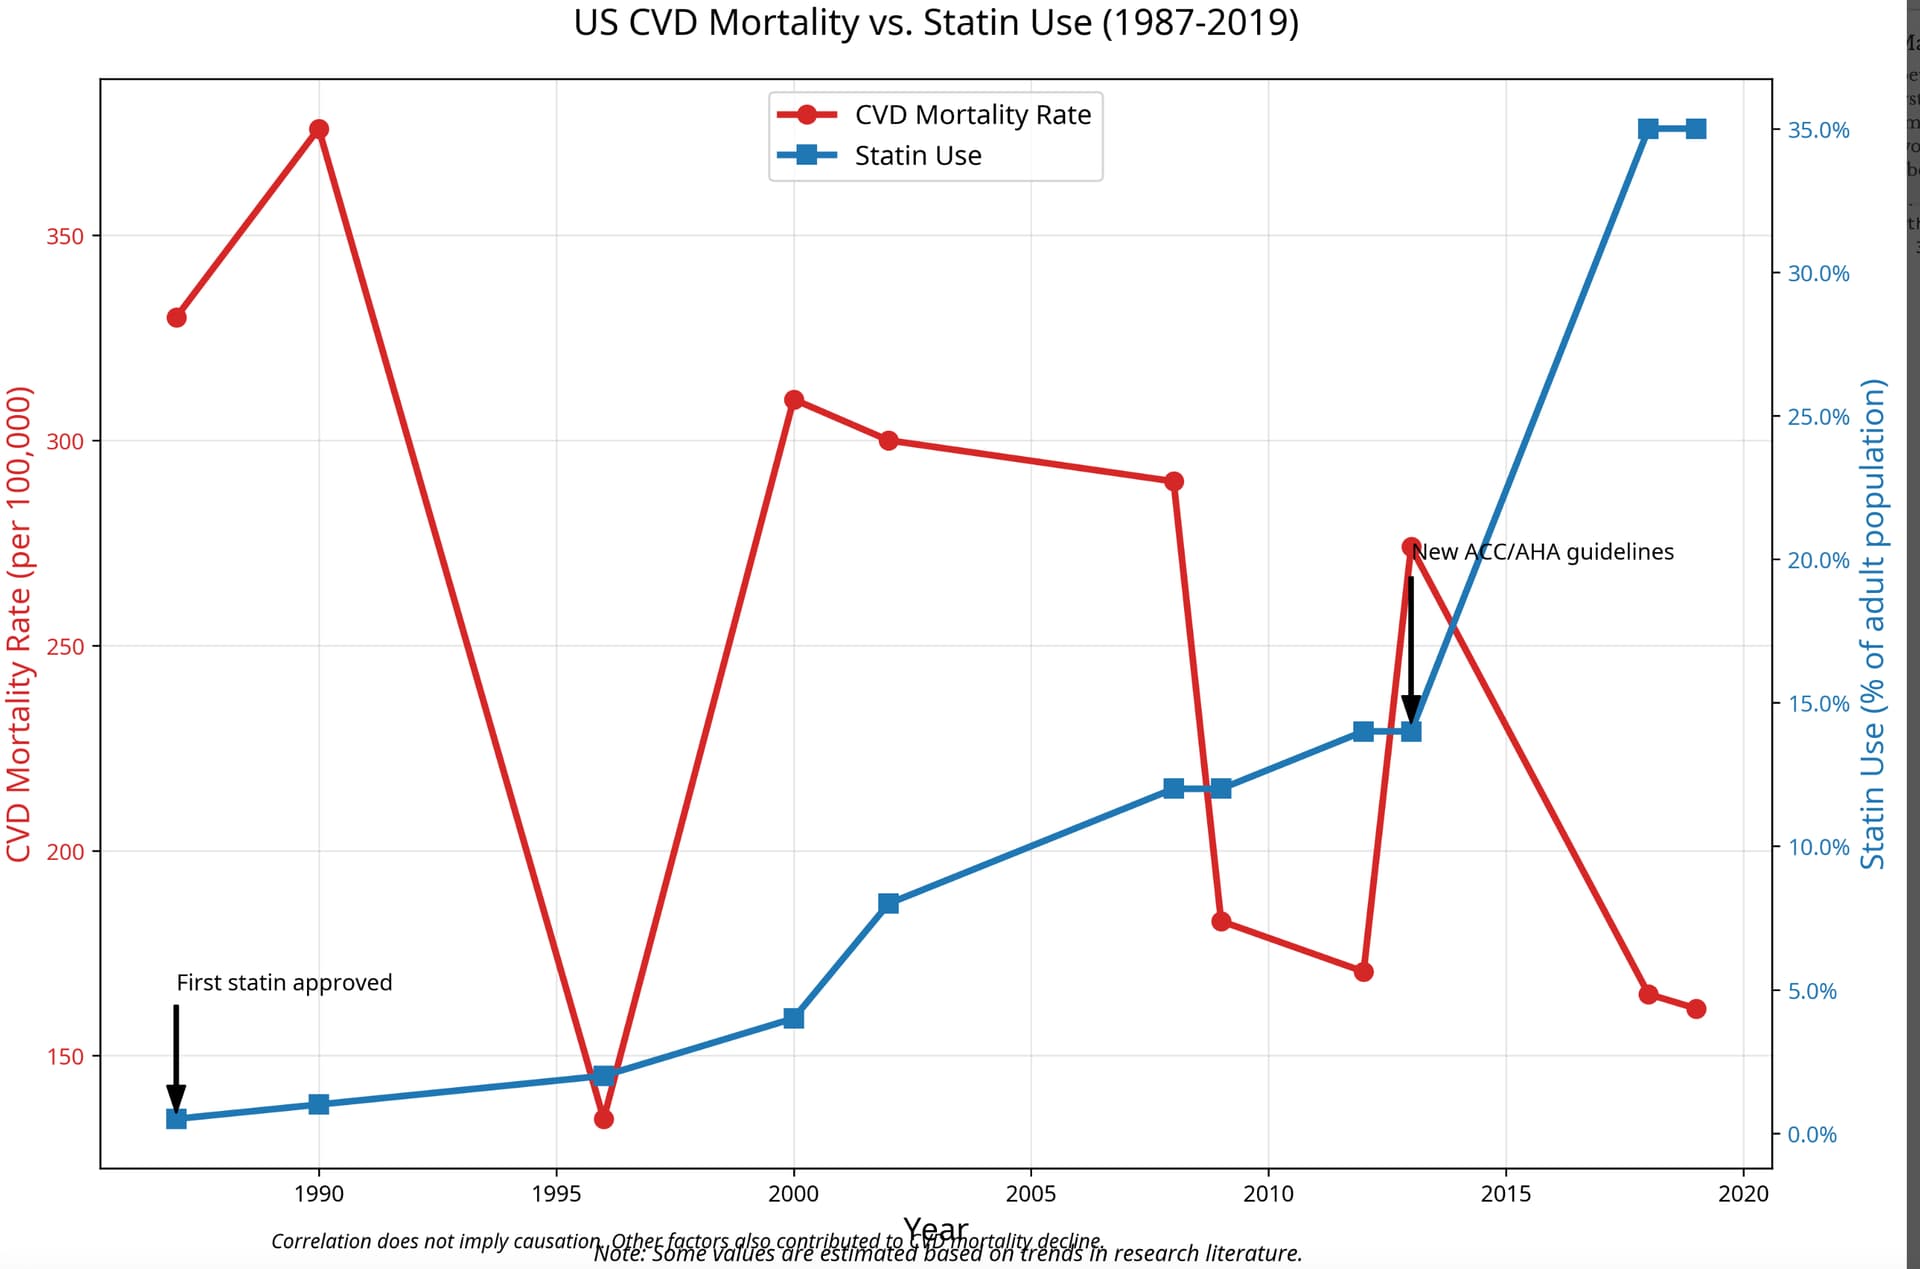
Looking at these graphs of CVD mortality rates, I thought again about my very favorite public health intervention program - The North Karelia Project. I think it is super interesting, in that the numbers from the graph AnUser posted match very closely the Finnish numbers. In 1980, the CVD death rates for males in the USA was roughtly 507/100K. In Finland CVD deaths in the late 60’s, early 70’s was about 500/100K - in the famous Ancel Keys Seven Countries Study, Finland had the worst statistics. Finland during that period of time had the highest rates of death from heart attacks in the world. It is quite sobering to consider that present day USA has CVD mortality rates on a similar level, and here we are, in the 2020’s where you’d think we’ve learned our lessons. In the North Karelia province of Finland, the rates were an astronomical 700/100K during the late 60’s early 70’s. There were many factors epidemiologists, physicians and health officials zeroed in on: cholesterol levels, smoking and blood pressure. Finland had the highest cholesterol levels on a population level recorded in any country. Notably, Finland reached the 500/100K CVD mortality rates with smoking rates dramatically higher than current smoking rates in the USA - which tells us, that the risk factors in the USA leading to the current horrendous CVD mortality rates must be somewhat different than in Finland of that era. We managed to get to 500/100K despite much lower smoking rates - quite an “accomplishment”.

The North Karelia Project is a gold mine of data and a stellar example of an extremely successful public health intervention - it is the finest achievement in lowering CVD death rates by public policy anywhere in the world, at any time. When I see endless arguments about cholesterol or diet - I just think of the North Karelia Project, which is a direct refutation of so many talking points by various folks when it comes to cholesterol and diet.

The North Karelia Project: Cardiovascular disease prevention in Finland

I give a quotation below, but really the whole paper is worth reading, it is so rich in data! For that matter it is worth buying books about this - for anyone interested in the subject of CVD health, this is absolutely wonderful reading.

"Serum cholesterol level and diet

Before the 1970s North Karelia was a poor, rural area. Small farming and forest industry were the main occupations. After the Second World War, the living standard started to improve rapidly. The dairy industry developed and people had enough food to eat. Dairy products were highly valued and a high intake of butter, cream, full milk, and cheese was regarded especially healthy. It was, therefore, painful to recognize that this diet seemed to be one of the main reasons for high mortality rates from cardiovascular diseases. The following advice was given to the population5:

  • use low-fat milk, non-fat milk or sour milk instead of high-fat or whole milk

  • use other low-fat dairy products instead of high-fat products

  • cut down the amount of butter or margarine on bread and change to soft margarine or soft butter (mixture of butter and oil)

  • cut off visible fat in meat, choose lean meat and sausages, and prefer fish and poultry

  • prepare food without adding extra (animal) fat, in cooking prefer boiling and baking

  • use vegetable oil in salad dressing and when baking

  • restrict the use of eggs (egg yolk) to only a couple per week

  • increase intake of whole-grain cereals

  • increase consumption of vegetables, roots, berries and fruits

Most of these original recommendations are still valid in Finnish society. Hard margarines have almost disappeared after the role of trans fats was discovered in the 1980’s. At present, soft butter contains mainly butter and very little oil. Soft margarines are recommended nowadays instead.

The nutritional messages were spread through different channels and in connection with different activities in the community. During the original project period (1972–1977) a total of 342 newspaper articles were published, in addition to 769 articles dealing with other risk factors, over 100,000 leaflets were distributed. Hundreds of training seminars were organized for healthcare workers, mass catering personnel, and the general public. Diet was discussed in 167 health education meetings attended by 12,100 participants. Local housewives associations (the Martha Association) organized 344 special “parties of long life” in local villages where healthy food was cooked and served to village members. Over 15,000 people participated in these meetings. Special training meetings were organized to change the diet in mass catering at workplaces, schools, hospitals and restaurants.

On a national level, since the 1980’s, several sectors became involved. National dietary guidelines were published for the first time in 1981 by the National Nutrition Council. A national cholesterol consensus meeting was held in 1989. Guidelines on prevention of coronary heart disease in Finland were published in 1987, together with national health authorities and voluntary organizations. Since then, these documents have been updated regularly.

Government became more involved and gave a health policy statement in 1985 where the role of healthy nutrition as an important goal was recognized. The law on dietary fats in 1987 allowed mixing dietary fats and oils to make new types of products available. The Finnish food industry has, with increasing health consciousness of consumers, been very active in developing new low fat products. In addition to low fat milks and spreads, low fat cheese, ice cream, sausages etc have appeared in the markets. Later, margarine with plant sterols was developed. A new variety of rapeseed oil was developed and it became widely used in homes and the margarine industry. Many voluntary organizations have also been very active, especially the Finnish Heart Association. Large-scale public health campaigns were organized in mass media. Health issues also became an important topic in magazines, newspapers and TV and radio programs.

Serum cholesterol reduced in North Karelia between 1972 and 2012 from 6.92 mmol/l to 5.46 mmol/l (−21%) in men and from 6.81 mmol/l to 5.37 mmol/l (−21%) in women5. In men, serum cholesterol level reduced more in North Karelia than in the reference province Kuopio during the first five years from 1972 to 1977. Since then, the development in serum cholesterol level has been very similar in different parts of the country (Figure 2). Saturated fats reduced from 20% of energy intake to 12% in 2007, and increased from 2007 to 2012 to 14%. Most of the decline was explained by dietary changes and only small amount (0.14 mmol/l) was explained by increased statin use since the 1980s."

4 Likes

Wonder how much the timing of strokes and heart attacks are stress related

(I know that even just the stress of daylight savings changes leads to a spike in heart attached and strokes).

If so the one data point 2010-15 combined - could be driven by extreme stress that the great recession and significant job destruction that followed after the global financial crises

And the last 2020 datapoint could be from the stress and job destructions that the first part of the Covid pandemic lead to

Basically medium and long term heart attacks and strokes are driven by lipids, obesity, etc

But the timing of heart attacks and strokes can be “pulled” forward by large stress… and the Great Recession and its wake and Covid were times when there was a lot of stress across the country and world

3 Likes

The increase in CVD is a culmination of earlier decades of obesity. You need to look at a 10+ year lag period. The second part of my sentence also said “and insulin resistance”. It’s a combination of obesity and insulin resistance which does you in.

Exactly. Those people were obese in the 2000s, and they’re having their heart attacks a decade later.

If you go back to the graph, you have a steep lowering of deaths from 2000 to 2010. That is nothing to do with us being less obese. That reduction is largely thanks to better hospital procedures, like reperfusion (percutaneous coronary intervention) to remove clots, and streamlined procedures to get potential heart attack victims into the cath lab as fast as possible. That’s optimising everything from the paramedics at the scene, to the ability of the ambulance to pull up directly next to the cath lab.

People did get fatter during the 2000s, and that’s when you see an uptick from 2010 to 2015.

And as I said, now we’re seeing emergence of new diseases like HFpEF.

The 2010-2011 point is interpolated. If you look at the graph of the actual data points, the total increase from 2010 to 2015 is no more extreme that the rate of decrease from 2005 to 2010.

Nobody said they did. The graph is CVD deaths. Of course people got fatter, but we got a lot better at treating heart attacks during the 2000s. Survival rates are way better now than they used to be. More people HAVE heart disease, but less were DYING from it. Now, we’ve basically used up the benefits of the improved treatment and the deaths are catching up again.

Also, you are right about obesity steadily rising - and you see a culmination of CVD deaths happening a couple decades later.

Basically, just because obesity is responsible for the increased deaths now, it doesn’t mean that less deaths in the past is explained by a change in obesity. A graph like that showing CVD deaths is affected by literally hundreds of things.

1 Like

My uric acid is between 3.5 and 4.4 mg/dl and depends on my diet. What’s yours that you need medication to reduce it?

Yours is optimal. Mine has hovered between 6.2 and 7.6 over the last two years, which brought on four cases of gout, two moderate and two severe. Like you, I’m on a fairly strict renal diet, with the occasional break. The acid-lowering drugs allow me an occasional break from the gout diet. And both are renoprotective. What’s your GFR again?

Yeah I’m not buying “we got worse at treating heart disease after 2010” either.

2 Likes

It would be interesting to see a similar mortality graph 1980-2020, but for cancer. No. 2 killer, but it’s the trends that are interesting, especially with the disparity in treatment outcomes. I suppose smoking is a gigantic factor.

What do you guys and @CronosTempi think about the potential hypothesis I laid out?