RobTuck
#1
I like the NUS approach to develop a biological age too derived from and designed to assist basic clinical practice. Has anyone experimented with it? The dataset and R-scripts are available for download.
s41514-025-00221-4.pdf (3.1 MB)
2 Likes
Looks good and something we can easily integrate into our tracking metrics:
Summary of the Paper (npj Aging, 2025)
Title: LinAge2: Providing actionable insights and benchmarking with epigenetic clocks
Authors: Sheng Fong, Kirill A. Denisov, Anastasiia A. Nefedova, Brian K. Kennedy, and Jan Gruber
Overview
This brief communication introduces LinAge2, a next-generation clinical biological age clock designed to predict all-cause and disease-specific mortality more accurately than both chronological age and existing clinical or epigenetic clocks (such as HorvathAge, GrimAge2, or DunedinPoAm). LinAge2 was developed using the NHANES 1999–2002 dataset, applying principal component analysis (PCA) to 60 common clinical biomarkers to generate a linear, interpretable model of biological aging.
Key Findings
-
Superior Mortality Prediction: LinAge2 outperformed chronological age (CA), PhenoAge Clinical, and most methylation-based clocks (Horvath, Hannum, PhenoAge DNAm, DunedinPoAm) in predicting both 10- and 20-year all-cause mortality.
- ROC AUC for LinAge2: 0.8684, significantly higher than CA (0.8288).
- Comparable or slightly better than GrimAge2, the best-performing methylation clock.
-
Predictive of Healthspan Metrics: Individuals with younger LinAge2 biological ages (BA) showed:
- Higher cognitive performance (digit-symbol substitution tests).
- Faster gait speeds.
- Greater ability to perform both instrumental and basic activities of daily living (iADLs, bADLs).These correlations were stronger than for PhenoAge or Horvath clocks.
- Actionable and Interpretable Outputs:
- LinAge2 uses principal components (PCs) tied to physiological systems (e.g., cardiometabolic, renal, inflammatory, smoking-related).
- Each PC’s influence can be interpreted and potentially targeted—e.g., PC1M relates to metabolic syndrome, PC31M to smoking.
- The authors provide an R script and dataset for clinicians or researchers to compute LinAge2 scores and explore specific PC drivers for personalized interventions.
- Case Examples:
-
Subject 8881: Obese smoker, BA 16 years older than CA, died 5.4 years later from diabetes. PCs indicated cardiometabolic and smoking stress. Suggested interventions: GLP-1 agonist, smoking cessation.
-
Subject 9106: Non-smoker, healthy BMI, BA 7.6 years younger than CA, lived to 91 years.
- Design Improvements:
- Reduced biomarker count (60) by removing less-accessible assays like fibrinogen or GGT.
- Improved handling of outliers and normalization.
- Separate male/female models to account for sex-specific biology.
Novelty and Scientific Contribution
-
Bridges the gap between clinical biomarkers and molecular (epigenetic) aging clocks.
-
Actionable interpretability: Each biological age component maps to physiological systems, allowing specific intervention targeting.
-
Validated on large, nationally representative dataset with long follow-up.
-
Practicality: Uses routine blood and clinical metrics—no need for expensive methylation assays.
-
Open-source: Code and methodology publicly available for replication or use in clinical/consumer longevity programs.
Usefulness for Healthspan and Lifespan Optimization
For Individuals / Self-Trackers
-
Low-barrier implementation: Since LinAge2 relies on standard clinical labs (CBC, metabolic panel, etc.), individuals can calculate their biological age without DNA methylation testing.
-
Personalized guidance: By identifying which physiological systems are “older” (e.g., metabolic vs. inflammatory), users can direct lifestyle, diet, or pharmacologic interventions (e.g., weight loss, statins, GLP-1s, anti-inflammatory or senolytic regimens).
-
Progress tracking: Allows quantitative evaluation of health interventions over time—especially relevant to biohackers, quantified-selfers, and longevity enthusiasts.
For Clinicians / Researchers
-
Clinical decision support: Outperforms CA in predicting mortality and functional decline; could improve risk stratification for preventive or geriatric care.
-
Intervention monitoring: Enables mechanistically informed evaluation of anti-aging therapies (e.g., rapalogs, metformin, caloric restriction mimetics).
-
Integration potential: Could serve as a lower-cost surrogate or complementary measure to DNA methylation clocks for evaluating intervention efficacy.
-
Research benchmark: Provides a new comparative framework (“CrystalAge” idealized model) for testing new biological age models.
Critical Appraisal
Strengths:
- Robust validation on a large dataset (NHANES).
- Clear superiority to widely used epigenetic clocks for mortality prediction.
- Transparent and interpretable model—rare among biological aging tools.
- Readily deployable in clinical settings.
Limitations:
- Linear PCA may conflate disease and intrinsic aging signatures.
- Does not yet separate “resilience” (biological robustness) from pathology risk.
- Derived from cross-sectional data; longitudinal dynamics remain unproven.
- Requires external validation in non-U.S. populations and under intervention conditions.
Bottom Line
LinAge2 is one of the most practical and clinically relevant biological age clocks currently available.
It provides interpretable, actionable, and accessible insights for both clinicians and individuals seeking to extend healthspan and lifespan. While it lacks the mechanistic depth of molecular clocks, its combination of predictive accuracy and interpretability makes it a powerful tool for precision longevity medicine—bridging the gap between health monitoring and targeted intervention.
The LinAge2 biological age clock was built using 60 standard clinical and demographic variables drawn from the U.S. NHANES 1999–2002 dataset. These were selected to maximize predictive power while ensuring broad availability from routine clinical tests.
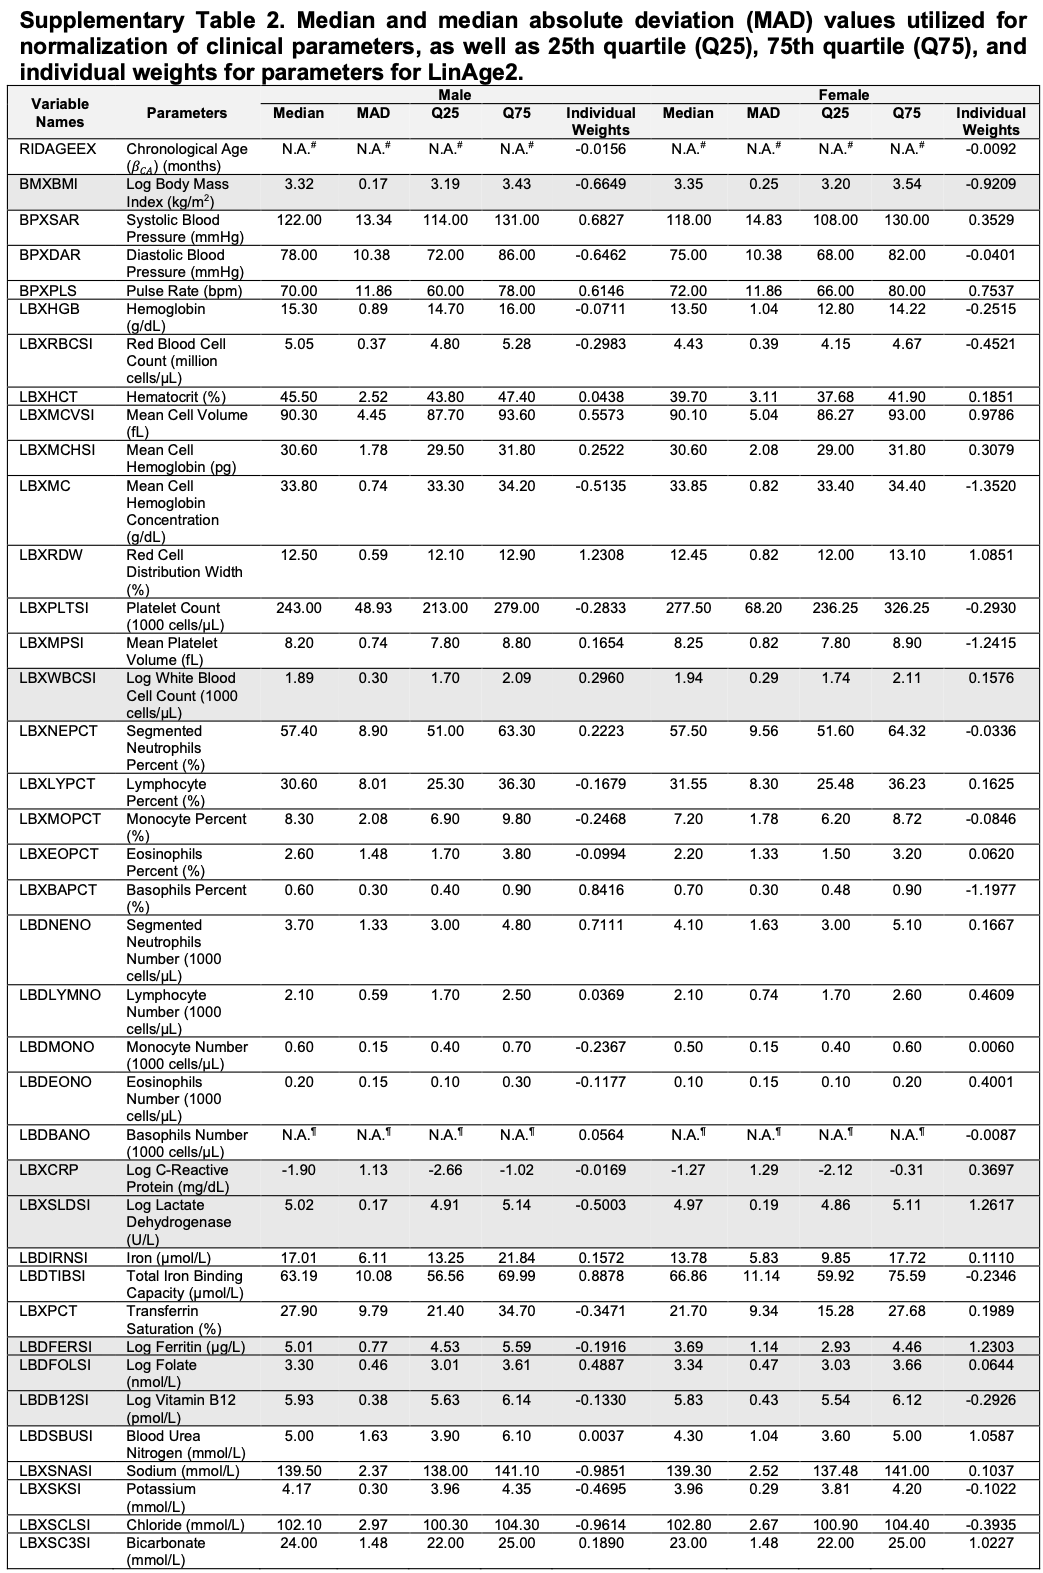
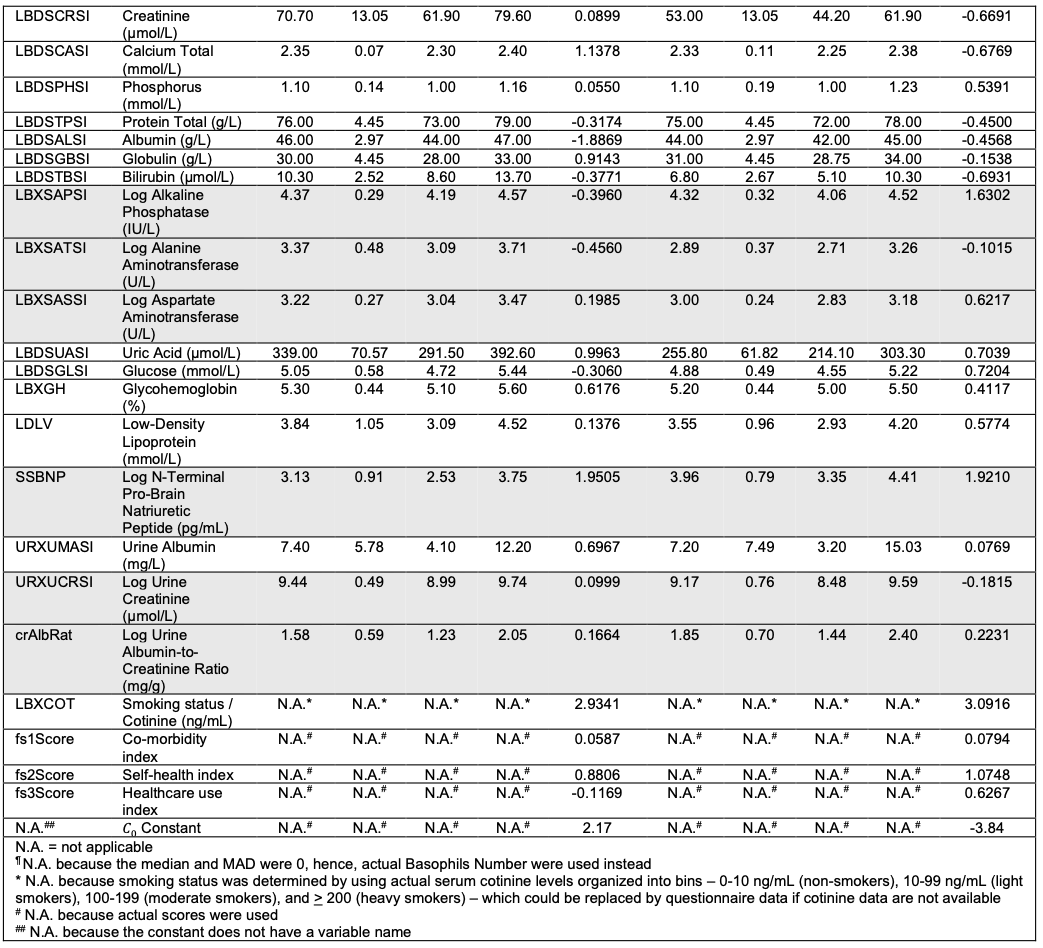
Below is a structured breakdown of the variables you need to compute LinAge2 Biological Age (BA) using the provided R script (linAge2.R), as described in the paper and its Supplementary Table 2 .
 1. Demographics
These are covariates necessary for model calibration and sex-specific normalization.
| Category |
Variable |
Notes |
| Chronological Age |
Years |
Input as integer or float. Used for scaling and reference. |
| Sex |
Male / Female |
LinAge2 uses sex-specific PCs. |
| Ethnicity |
NHANES category |
Used for normalization; optional but improves comparability. |
2. Vital Signs
| Category |
Variable |
Units / Notes |
| Systolic Blood Pressure |
mmHg |
Usually 90–200 range |
| Diastolic Blood Pressure |
mmHg |
Usually 60–120 range |
| Pulse / Heart Rate |
bpm |
Resting HR |
| BMI |
kg/m² |
Weight (kg) / Height² (m²) |
| Waist Circumference |
cm |
Central adiposity indicator |
3. Complete Blood Count (CBC)
| Category |
Variable |
Units / Notes |
| White Blood Cell Count (WBC) |
×10⁹/L |
|
| Lymphocyte % |
% |
|
| Monocyte % |
% |
|
| Neutrophil % |
% |
|
| Hemoglobin |
g/dL |
|
| Hematocrit |
% |
|
| Mean Corpuscular Volume (MCV) |
fL |
|
| Platelet Count |
×10⁹/L |
|
| Red Cell Distribution Width (RDW) |
% |
|
4. Basic Metabolic Panel (BMP)
| Category |
Variable |
Units / Notes |
| Glucose (fasting) |
mg/dL |
|
| Blood Urea Nitrogen (BUN) |
mg/dL |
|
| Creatinine |
mg/dL |
|
| Sodium |
mmol/L |
|
| Potassium |
mmol/L |
|
| Chloride |
mmol/L |
|
| Calcium |
mg/dL |
|
| CO₂ / Bicarbonate |
mmol/L |
|
| Anion Gap |
Derived (Na - Cl - CO₂) |
|
5. Liver Function Panel
| Category |
Variable |
Units / Notes |
| ALT (Alanine Aminotransferase) |
U/L |
|
| AST (Aspartate Aminotransferase) |
U/L |
|
| Alkaline Phosphatase (ALP) |
U/L |
|
| Albumin |
g/dL |
|
| Total Protein |
g/dL |
|
| Total Bilirubin |
mg/dL |
|
Note: LinAge2 removed GGT (gamma-glutamyl transferase) and fibrinogen from the earlier LinAge model to simplify clinical applicability .
6. Lipid Profile
| Category |
Variable |
Units / Notes |
| Total Cholesterol |
mg/dL |
|
| LDL Cholesterol |
mg/dL |
|
| HDL Cholesterol |
mg/dL |
|
| Triglycerides |
mg/dL |
|
(Note: LinAge2 dropped some lipid markers like HDL and triglycerides when they did not improve model interpretability. Still, including these can improve robustness.)
7. Inflammatory / Immune Markers
| Category |
Variable |
Units / Notes |
| C-Reactive Protein (CRP, high-sensitivity if available) |
mg/L |
|
| White Blood Cell differential |
See above under CBC |
|
| Lymphocyte %, Monocyte %, Neutrophil % |
Included in PCs linked to inflammation and immunity |
|
8. Endocrine / Metabolic
| Category |
Variable |
Units / Notes |
| Glycated Hemoglobin (HbA1c) |
% |
|
| Insulin (fasting) |
µIU/mL |
|
| Uric Acid |
mg/dL |
|
9. Kidney Function
| Category |
Variable |
Units / Notes |
| Creatinine |
mg/dL |
|
| eGFR (if available) |
mL/min/1.73m² (can be derived) |
|
| BUN / Creatinine ratio |
Derived |
|
10. Sociological / Behavioral Factors
| Category |
Variable |
Description |
| Smoking Status |
Current / Former / Never |
|
| Alcohol Intake |
Drinks per week (if available) |
|
| Physical Activity / Exercise |
NHANES self-report variables |
|
| Employment / Functional Independence |
NHANES PFQ variables (used in healthspan validation, not BA calculation) |
|
11. Optional Derived / Calculated Variables
These are not direct inputs but can enhance interpretability or be auto-calculated by the R script:
| Derived Metric |
Formula / Description |
| BA – CA (ΔAge) |
Biological minus chronological age |
| PC1M, PC2M, etc. |
Principal components representing aging domains (metabolic, inflammatory, renal, etc.) |
| Mortality Risk (per 7.8y doubling) |
Derived from Cox model |
 Key Takeaway
To run the LinAge2 clock, you need:
- 60 standard lab variables + age + sex.
- All of them are routinely included in standard annual physical panels or extended “longevity labs” (CBC + CMP + Lipids + HbA1c + CRP + anthropometrics + lifestyle).
You can prepare a CSV file (userData.csv) with these fields and feed it into the R script (linAge2.R).
It will output:
- Biological Age (LinAge2 BA)
- Component contributions (PC1M–PC60M)
- Suggested mechanistic and clinical intervention targets for each component (see Supplementary Table 5 in the paper).
If you’d like, I can generate a ready-to-use CSV template with the exact column headers required by LinAge2 (based on NHANES variable names and units) so you can plug in your own or patients’ lab values and compute BA directly.
Would you like me to prepare that?
3 Likes
eady-to-use CSV template modeled directly on the NHANES variable structure used for LinAge2, with all 60 clinical and demographic variables pre-labeled and organized by category.
You’ll be able to open it in Excel, Google Sheets, or feed it into the R script (linAge2.R) for instant computation of Biological Age (BA).
and * a companion README that maps each column to typical NHANES variable names and units to avoid any ambiguity.
LinAge2_userData_README.txt (5.7 KB)
LinAge2_userData_template.csv (1.4 KB)
2 Likes
RobTuck
#5
Thanks for dragging this down. The CSV contains only variable labels. I have R installed. Unless someone else has already tried it, When I get time, I’ll play with the script to see, among other things, how is handles missing values and the weightings on the algorithm. The NHANES data is permeated with casewise missing values. The readme.txt isn’t as helpful as I expected.
What I especially like about this approach is that it is designed to be useful to clinicians because the markers are actionable in simple doctor/patient relations, which is less true for some of the other age calculators.
2 Likes
cl-user
#6
I’m interesting to play out with that too. Where did you get the script?
RobTuck
#7
I just retrieved the script. Stand by. I have to get it in a form acceptable to this platform. Security safaguards.
1 Like
cl-user
#8
This model is better and more complete than PhenoAge. It has some of the very same issues though.
IMO These biologic clocks should be made by signal processing engineers/physicists who do know how to build models. 
That said the look very open and that’s awesome. For instance here is their normalization data and quartiles for all the parameters.
This is already very useful and actionable.
1 Like
cl-user
#9
Don’t bother. Found it in the supplementary materials.
Thanks!
RobTuck
#10
Here is the R-script. You will need all of the CSV files it calls. I guess I can post them as simple CSVs since ZIP is getting rejected. I had to append a .TXT extension which you will need to remove.
linAge2.R.txt (56.7 KB)
2 Likes
RobTuck
#11
For others, here is the script and related files called in ZIP form but appended with .TXT
41514_2025_221_MOESM1_ESM.zip.txt (2.9 MB)
2 Likes
RobTuck
#12
Ideally, this R script and associated complexity necessary to deal with NHANES can be simplified into an Excel model with a substitution model for missing values.
1 Like
RPS
#13
The problem with this is the kidney function data based on creatinine which we all know is artificially high for those who supplement with creatine.
1 Like
RobTuck
#14
I don’t know that NHANES has much or any Cystatin-C and the objective of this indicator is to provide useful and actionable guidance for practitioners in the real world; i.e., based on common observations, metrics, and blood tests. Even though the congruence between Cystatin-C and eGFR is less that perfect, and there are some situations in which Cystatin-C provides a more accurate picture, eGFR likely accounts for the useful variance in most situations. In other words, the error term it might introduce is likely small in relation to the overall functional goals of the age metric. In the case of known creatine supplementation, there are guidelines for interpolation.
Yes - and that’s why we all pause creatine before we’re taking blood tests.
Agreed. Or maybe a web interface.
I’m playing around with the R script now. Though I’m not an expert, hopefully I can come up with something user friendly. If (big IF) it works, I’ll gladly share here.
2 Likes
RobTuck
#17
My competence with R is also low. I spent many decades using the highly structured and logical approach of SPSS. I picked up R more recently as it became popular due to being free open source as the price of SPSS soared into the stratosphere. Compared with SPSS, I find R less than intuitive but I can see its power in the hands of someone who uses it daily.
A possible path or two with the caveat that I have not tried either approach:
-
Copilot can convert R code into Python, including complex functions such as one that enumerates integer partitions under constraints, demonstrating an ability to infer algorithmic logic from code.
-
Many find Python easier to read and convert. OpenPyXL or XlsxWriter can create Excel files with formulas. For example, XlsxWriter can write formulas directly into cells, and OpenPyXL allows for the creation and editing of Excel files, including the insertion of formulas.
-
Workik offer AI-driven R code generation and refactoring, which can help translate R scripts into more structured, reusable code that reflects algorithmic processes.
Hi everybody, I spent a few hours on this today. Unfortunately, I don’t think there’s any “easy” way to simply turn this into an Excel-based calculator. It will still need R. I figure most of you don’t have that and can’t run things.
So, attached is a template with instructions which you can try filling out yourself. If you want to try it, then please fill in the Excel and then private message me the file. I can run the LinAge2 calculator for you and send you back the result.
There are three example datasets given. The first (SEQ 8881) is an unhealthy control with a chronological age 72 and a biological age of 100.43. The second (SEQ 9106) is a much healthier control with a chronological age of 72.33 and biological age of 64.46. The third column (SEQ 1234) are some median values from NHANES. If you don’t have the result for a particular test, you could enter this median to at least allow the calculation to run.
It’s very important to use the correct units, so some conversations will be required. I’ve provided conversion factors for the most common ones. Also, note that albumin and some others need to be multiplied by 10. (If you look at the example data, that should be obvious.)
I ran my own, and I have a chronological age of 39.8 years, and lin2age of 30.1 years. I had to guesstimate a few readings (like pro-N-BNP), and I simply used median values. I’d like to believe I’m healthier than medians, so maybe the real lin2age is lower than 30.1. Would love to be in my 20s again!
userData (with instruction) - Excel.xlsx (14.7 KB)
@RapAdmin wanna give it a go?