(from https://twitter.com/theproof/status/1607622077879816192/photo/1 )
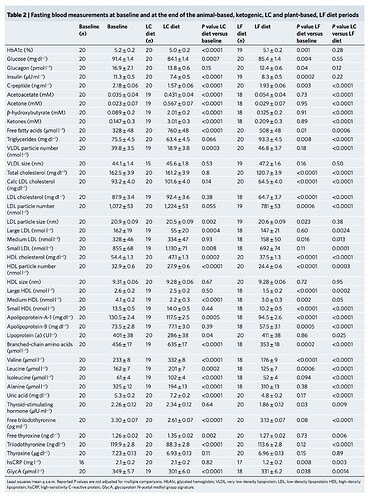
[low-fat vegetarians have better GLUCOSE than low-carb meat-eaters]. The only metrics vegetarians are worse on are triglycerides and free fatty acids (interestingly)
https://www.ncbi.nlm.nih.gov/pmc/articles/PMC4191896/
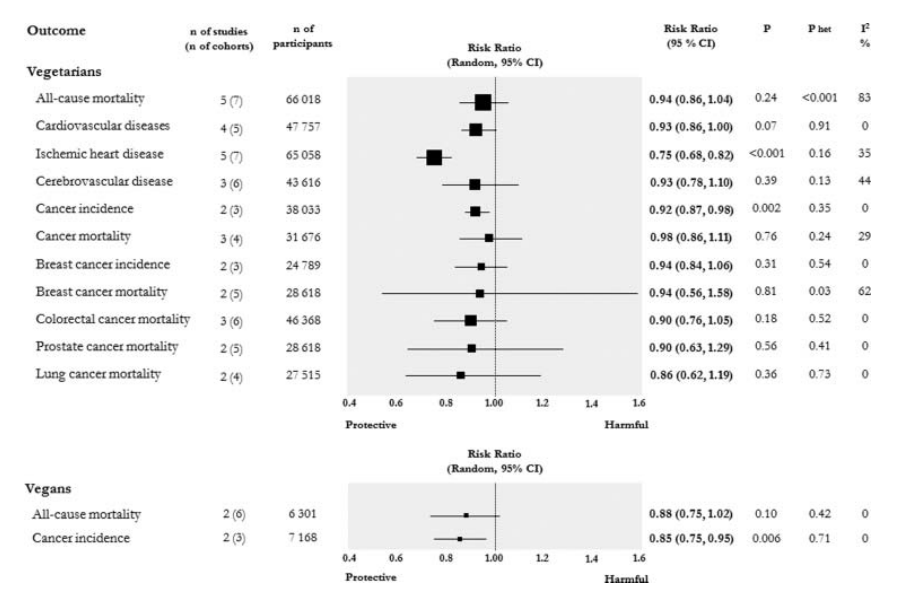
There were 2570 deaths among 73 308 participants during a mean follow-up time of 5.79 years. The mortality rate was 6.05 (95% CI, 5.82–6.29) deaths per 1000 person-years. The adjusted hazard ratio (HR) for all-cause mortality in all vegetarians combined vs non-vegetarians was 0.88 (95% CI, 0.80–0.97). The adjusted HR for all-cause mortality in vegans was 0.85 (95% CI, 0.73–1.01); in lacto-ovo–vegetarians, 0.91 (95% CI, 0.82–1.00); in pesco-vegetarians, 0.81 (95% CI, 0.69–0.94); and in semi-vegetarians, 0.92 (95% CI, 0.75–1.13) compared with nonvegetarians. Significant associations with vegetarian diets were detected for cardiovascular mortality, noncardiovascular noncancer mortality, renal mortality, and endocrine mortality. Associations in men were larger and more often significant than were those in women.
=====
epigenetic study below (it’s an isolated study so idk how generalizeable)
A gene list created by comparing the differentially methylated CpG sites observed in nonvegetarians and vegans was used to perform DAVID functional annotation clustering using its own Knowledgebase. This analysis revealed that out of 49 identified functional groups of genes (Table S4), the top cluster, as shown in Table 4, demonstrates enrichment of homeobox transcriptional factors. This enrichment is significant by a variety of statistical tests. The potential of these transcription factors to amplify differential activation may indicate that the presence or absence of animal proteins in the diet may lead to much larger differences in gene expression regulation than the relatively modest fold-changes detected by an epigenetics approach might suggest.
Table 4. Functional annotation cluster 1 report for vegans vs. nonvegetarians run with high classification stringency.

Similar results were obtained when we performed the same analysis under the same conditions using the gene list based on differential methylation detected in pescatarians vs. vegans. Table 5 shows that homeobox transcription factors again form the top functional cluster among all the genes used in analysis. However, statistical characteristics for pescatarians are weaker (Table 5).
Table 5. Functional annotation cluster 1 report run for vegans vs. pescatarians run with high classification stringency.
It is important to note that, out of 8 genes encoding homeobox transcription factors detected in pescatarians, 3 are found also in nonvegetarians, which indicate on nonrandom differences in methylation patterns (Table 6).
Table 6. CpG sites identified as differentially methylated in transcription factor genes in pescatarians.